Training and evaluating a graph model
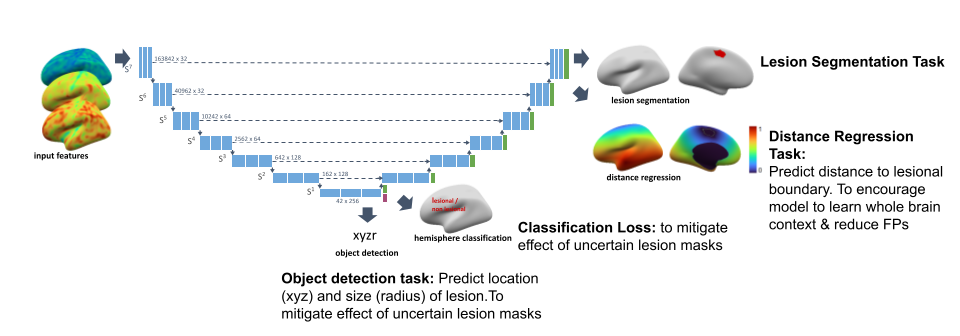
This package contains code for training and evaluating graph-based U-net lesion segmentation models operating on icosphere meshes. In addition to lesion segmentation, the models also contain auxiliary distance regression and hemisphere classification losses. For more information see our manuscript.
Code authors (alphabetical): Sophie Adler, Mathilde Ripart, Hannah Spitzer, Konrad Wagstyl
Notes
These scripts require the native installation of the package.
Basic commands to train and evaluate models are described below. For more details on the structure of the code and on configuration options, have a look at the code structure guide and at the example_experiment_config.py
Prepare files
Before training, we need to prepare scaling (for z-scoring) and augmentation parameters and downscaled icospheres.
These scripts only need to be run once, and will save parameter files in the data folder. A copy of the files we use is provided with this code. To reproduce these files, run:
scripts/data_preparation/create_scaling_parameters.py: calculates scaling params file.scripts/data_preparation/create_icospheres.py: creates downsampled icospheres.scripts/data_preparation/calculate_feature_means_stds.py: calculates mean and std of features for normalisation.scriptsdata_preparation/save_xx_parameters_icospheres.py: save precomputed augmentations.
Training
To train a single model, run
python train.py --config_file CONFIG_FILE
We can also train multiple models at once using a special config listing all config elements that should change over the runs. An example of this variable config can be found in scripts/config_files/fold_var.py.
Structure of this file:
base_name: base name of the models. Used for experiment names and names of config filesparallel: list of configs that should be run in parallel. Each entry of a list should be a dictionary with keys ‘network_parameters’ and ‘data_parameters’. NOTE that if you change an element of a dictionary, this does NOT delete the other elements of this dictionary. Eg, if the base config contains multiple losses, changing one loss in the var config does not delete the other losses.sequential: list of configs that should be run sequentially. These models will be finetuned from each the best model of the previous entry in the sequential list. For every parallel model, all sequential models will be run.
How to run multiple models:
# create all configs and save them to DIR
python create_config.py BASE_CONFIG VAR_CONFIG --save_dir DIR
# start training for all configs, with sequential models in sequence and parallel models in parallel
sbatch train_multiple.sh DIR
Evaluation
Cross validation experiments
For establishing the best hyperparameters, we use cross-validation.
python scripts/classifier/cross_val_aucs.py --experiment_path PATH_TO_EXPERIMENT --split val
This calculates and saves aucs for each fold in the experiment. The notebook auc_comparisons.ipynb can be used to compare these aucs for multiple models. The notebook compare_experiments.ipynb can be used for a quick check of model training curves for individual folds and per-vertex aucs (as opposed to subject-level sensitivity+specificity aucs) on the val sets.
Testing experiments
python scripts/classifier/cross_val_aucs.py --experiment_path PATH_TO_EXPERIMENT --split test
This runs on the test set and saves out the predictions for the test set for each of the folds. These then need to be ensembled and thresholded to compare experiments.
Ensemble final model
To create a final ensemble model, summarising all fold-specific models, run
python scripts/classifier/create_ensemble.py PATH_TO_EXPERIMENT_FOLDER
This will create an ensemble model in PATH_TO_EXPERIMENT_FOLDER/fold_all, ensembling all five folds in PATH_TO_EXPERIMENT_FOLDER/fold_XX. If other folds should be ensembled use the --folds argument.
Optimise threshold for evaluation
Before doing the evaluation you set the thresholds on the trainval dataset.
To simply run
python scripts/classifier/evaluate_trainval.py --model_path PATH_TO_EXPERIMENT --model_name best_model
python scripts/classifier/calculate_thresholds.py --model_path PATH_TO_EXPERIMENT
This will run the predictions on the trainval dataset and calculate the optimal thresholds that provide the best performances in term of sensitivity and dice score. The threshold parameters will be saved in the file “two_thresholds.csv” at PATH_TO_EXPERIMENT
Evaluate final model
To evaluate the ensemble model, simply use
python scripts/classifier/evaluate_single_model.py --model_path PATH_TO_EXPERIMENT --split test
This will automatically detect using the fold name if an ensemble is present of if a single fold model should be evaluated. To additionally calculate saliency values, add the flag --saliency.
This evaluation will threshold and cluster the predictions with the optimal sigmoid paramaters stored in PATH_TO_EXPERIMENT/sigmoid_optimal_parameters.csv
To compare final performance of models, update the model paths in compare_models.py script and run
python scripts/classifier/compare_models.py
This will produce a table of ensembled results on the model. The data tables and figures can be found in data/ and imgs/ inside the experiment folder.
Test model on new data
To test a trained model on new data, simply use the command below:
python scripts/classifier/evaluate_single_model.py --model_path PATH_TO_EXPERIMENT --split test --new_data NEW_DATA_JSON
You will need to provide the path to the trained model for --model_path , and provide a the path to a json file containing the information of your new data after --new_data. The json file will need to contain:
hdf5_file_root: name of the hdf5 that have your new data in the right formatdataset: a csv containing the dataset ids with all data as test splitsave_dir: a directory where to save the results.
An example of json file can be found at scripts/config_files/example_config_evaluate_new_data.json
Reproducibility
We ran all experiments and evaluations using version v1.0.0 of meld_graph.
The config file base_config.py and variable config files fold_var.py and fold_var_subsampling.py contain all experiments we ran for the manuscript.
An overview of the notebooks that we used to create the figures can be found here.